Oops! It looks like that page is gone!
But while you’re here, why not dive into some of the latest stories from across Minderoo Foundation.
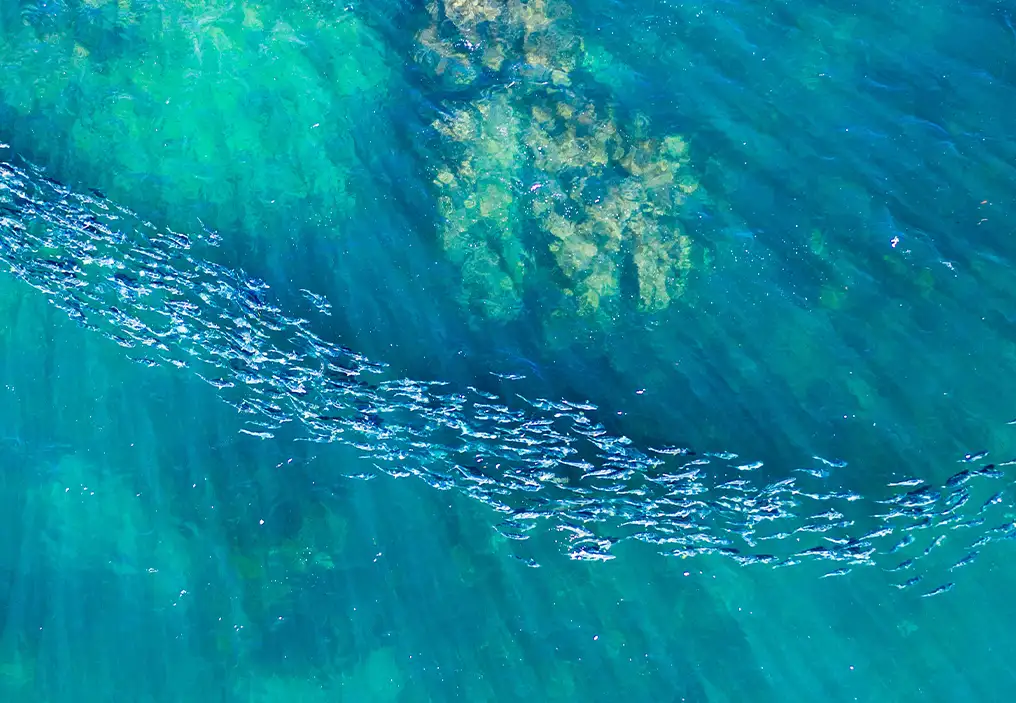
Natural Ecosystems Why we support 30x30.
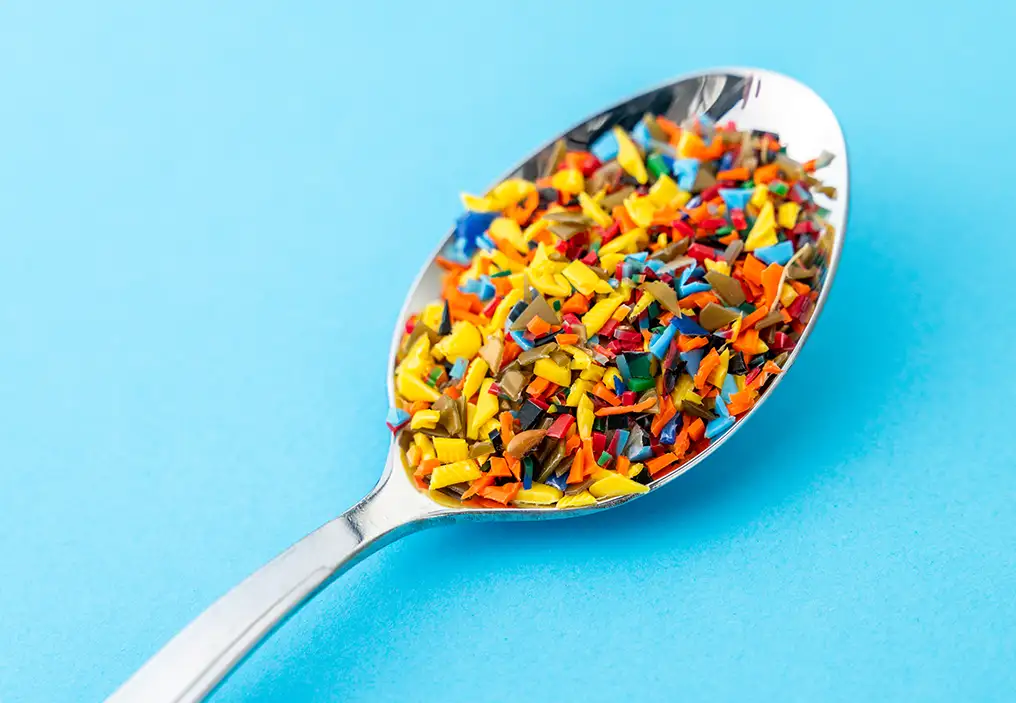
Plastics Could plastics be hiding in your food? New tool helps measure the invisible.
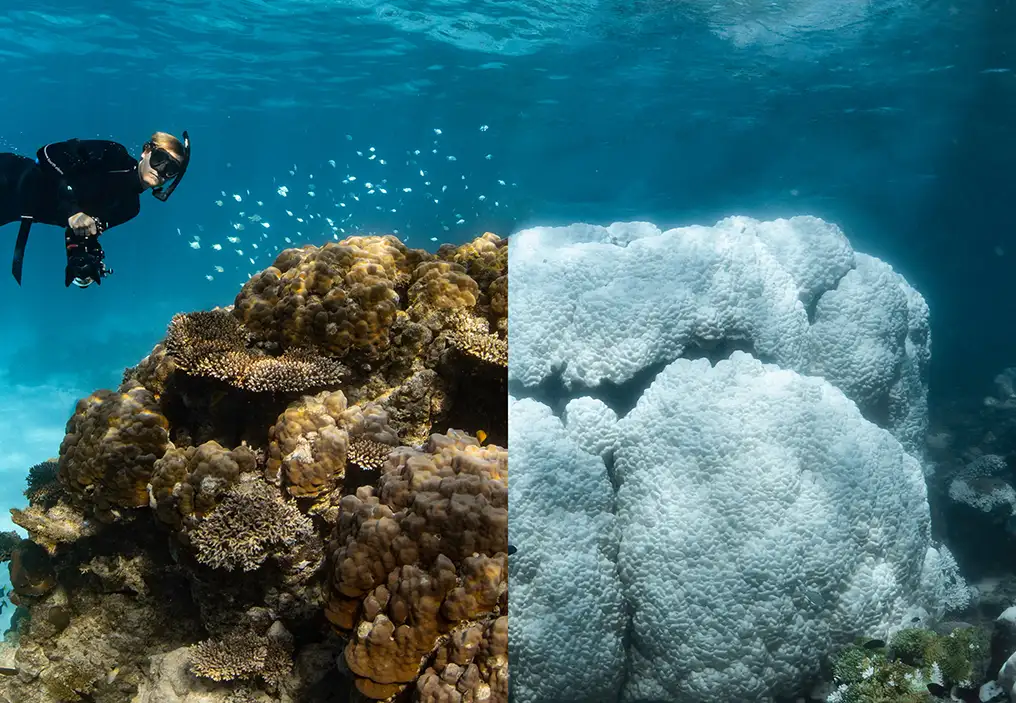
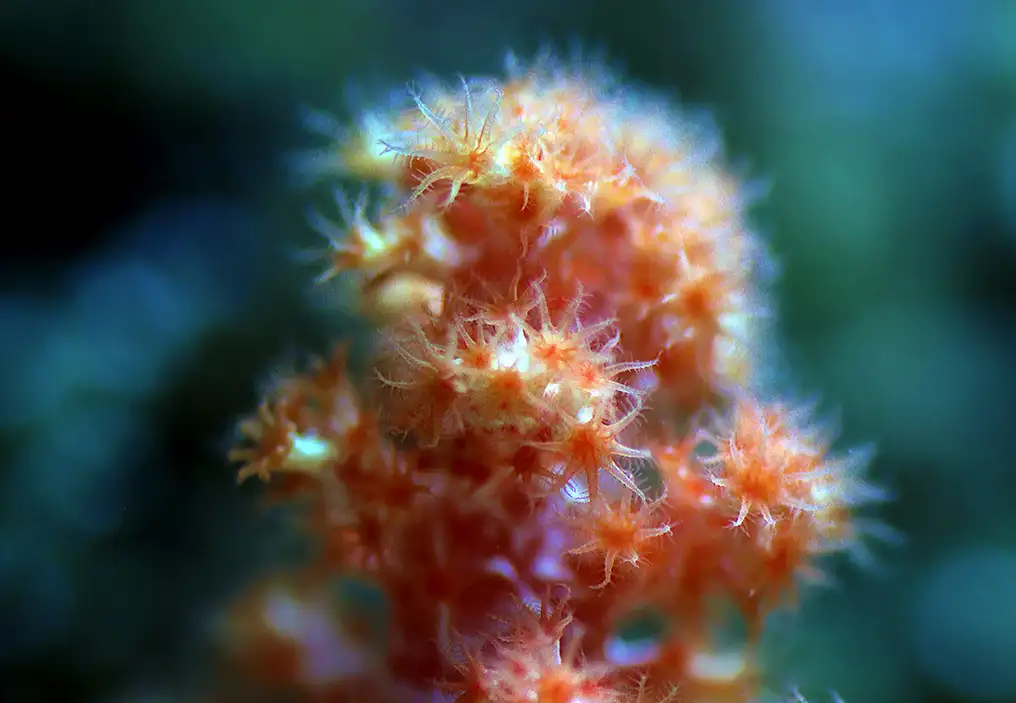
Natural Ecosystems InFocus: Ningaloo Coral Bleaching.
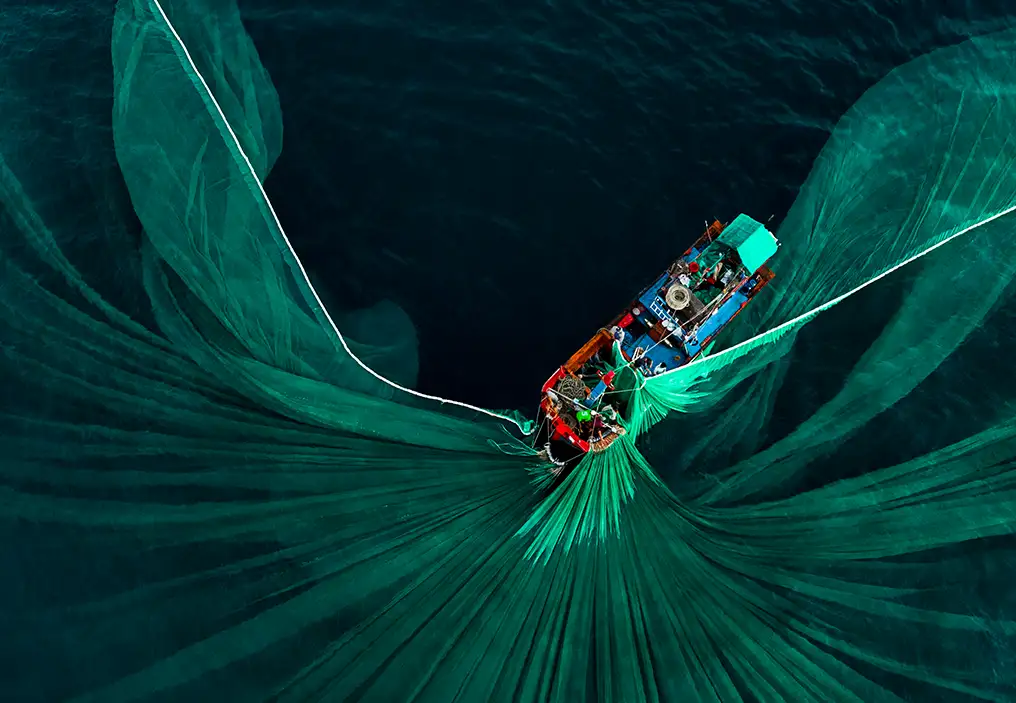
Natural Ecosystems A major global ocean summit is happening – here are 6 things you should know.
Natural Ecosystems eDNA: A new way to understand and protect marine life.
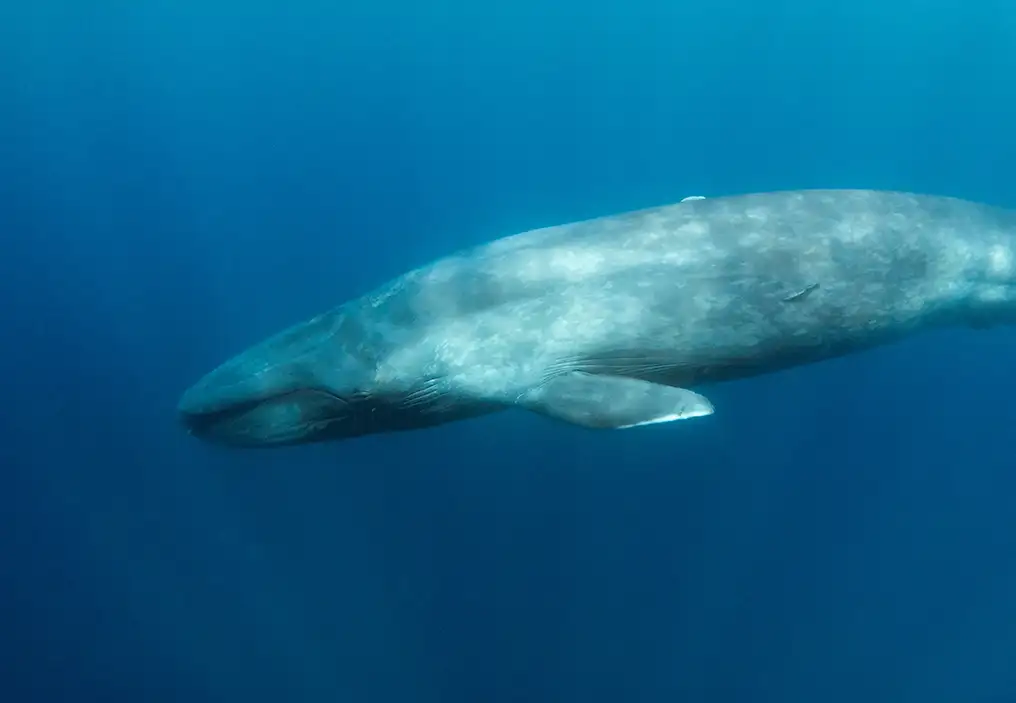
Natural Ecosystems Endangered whales in the firing line – and the science the industry missed.