Oops! It looks like that page is gone!
But while you’re here, why not dive into some of the latest stories from across Minderoo Foundation.
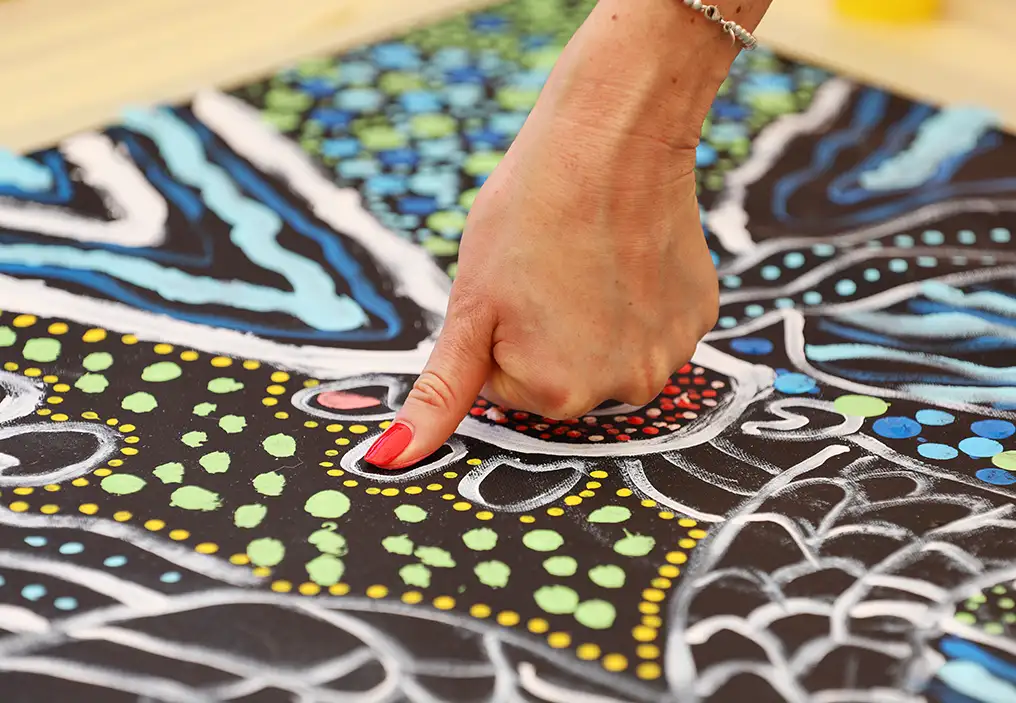
Foundation From GenerationOne to One Minderoo: 25 years supporting First Nations empowerment.
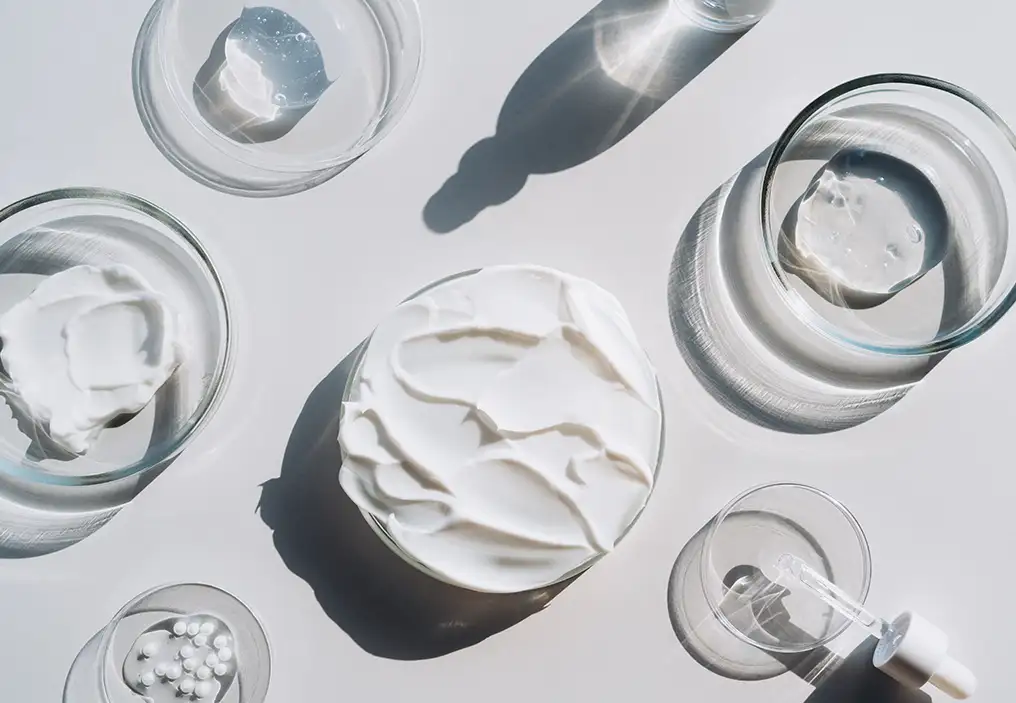
Plastics The hidden plastics in your beauty routine – and 6 things dermatologists recommend.
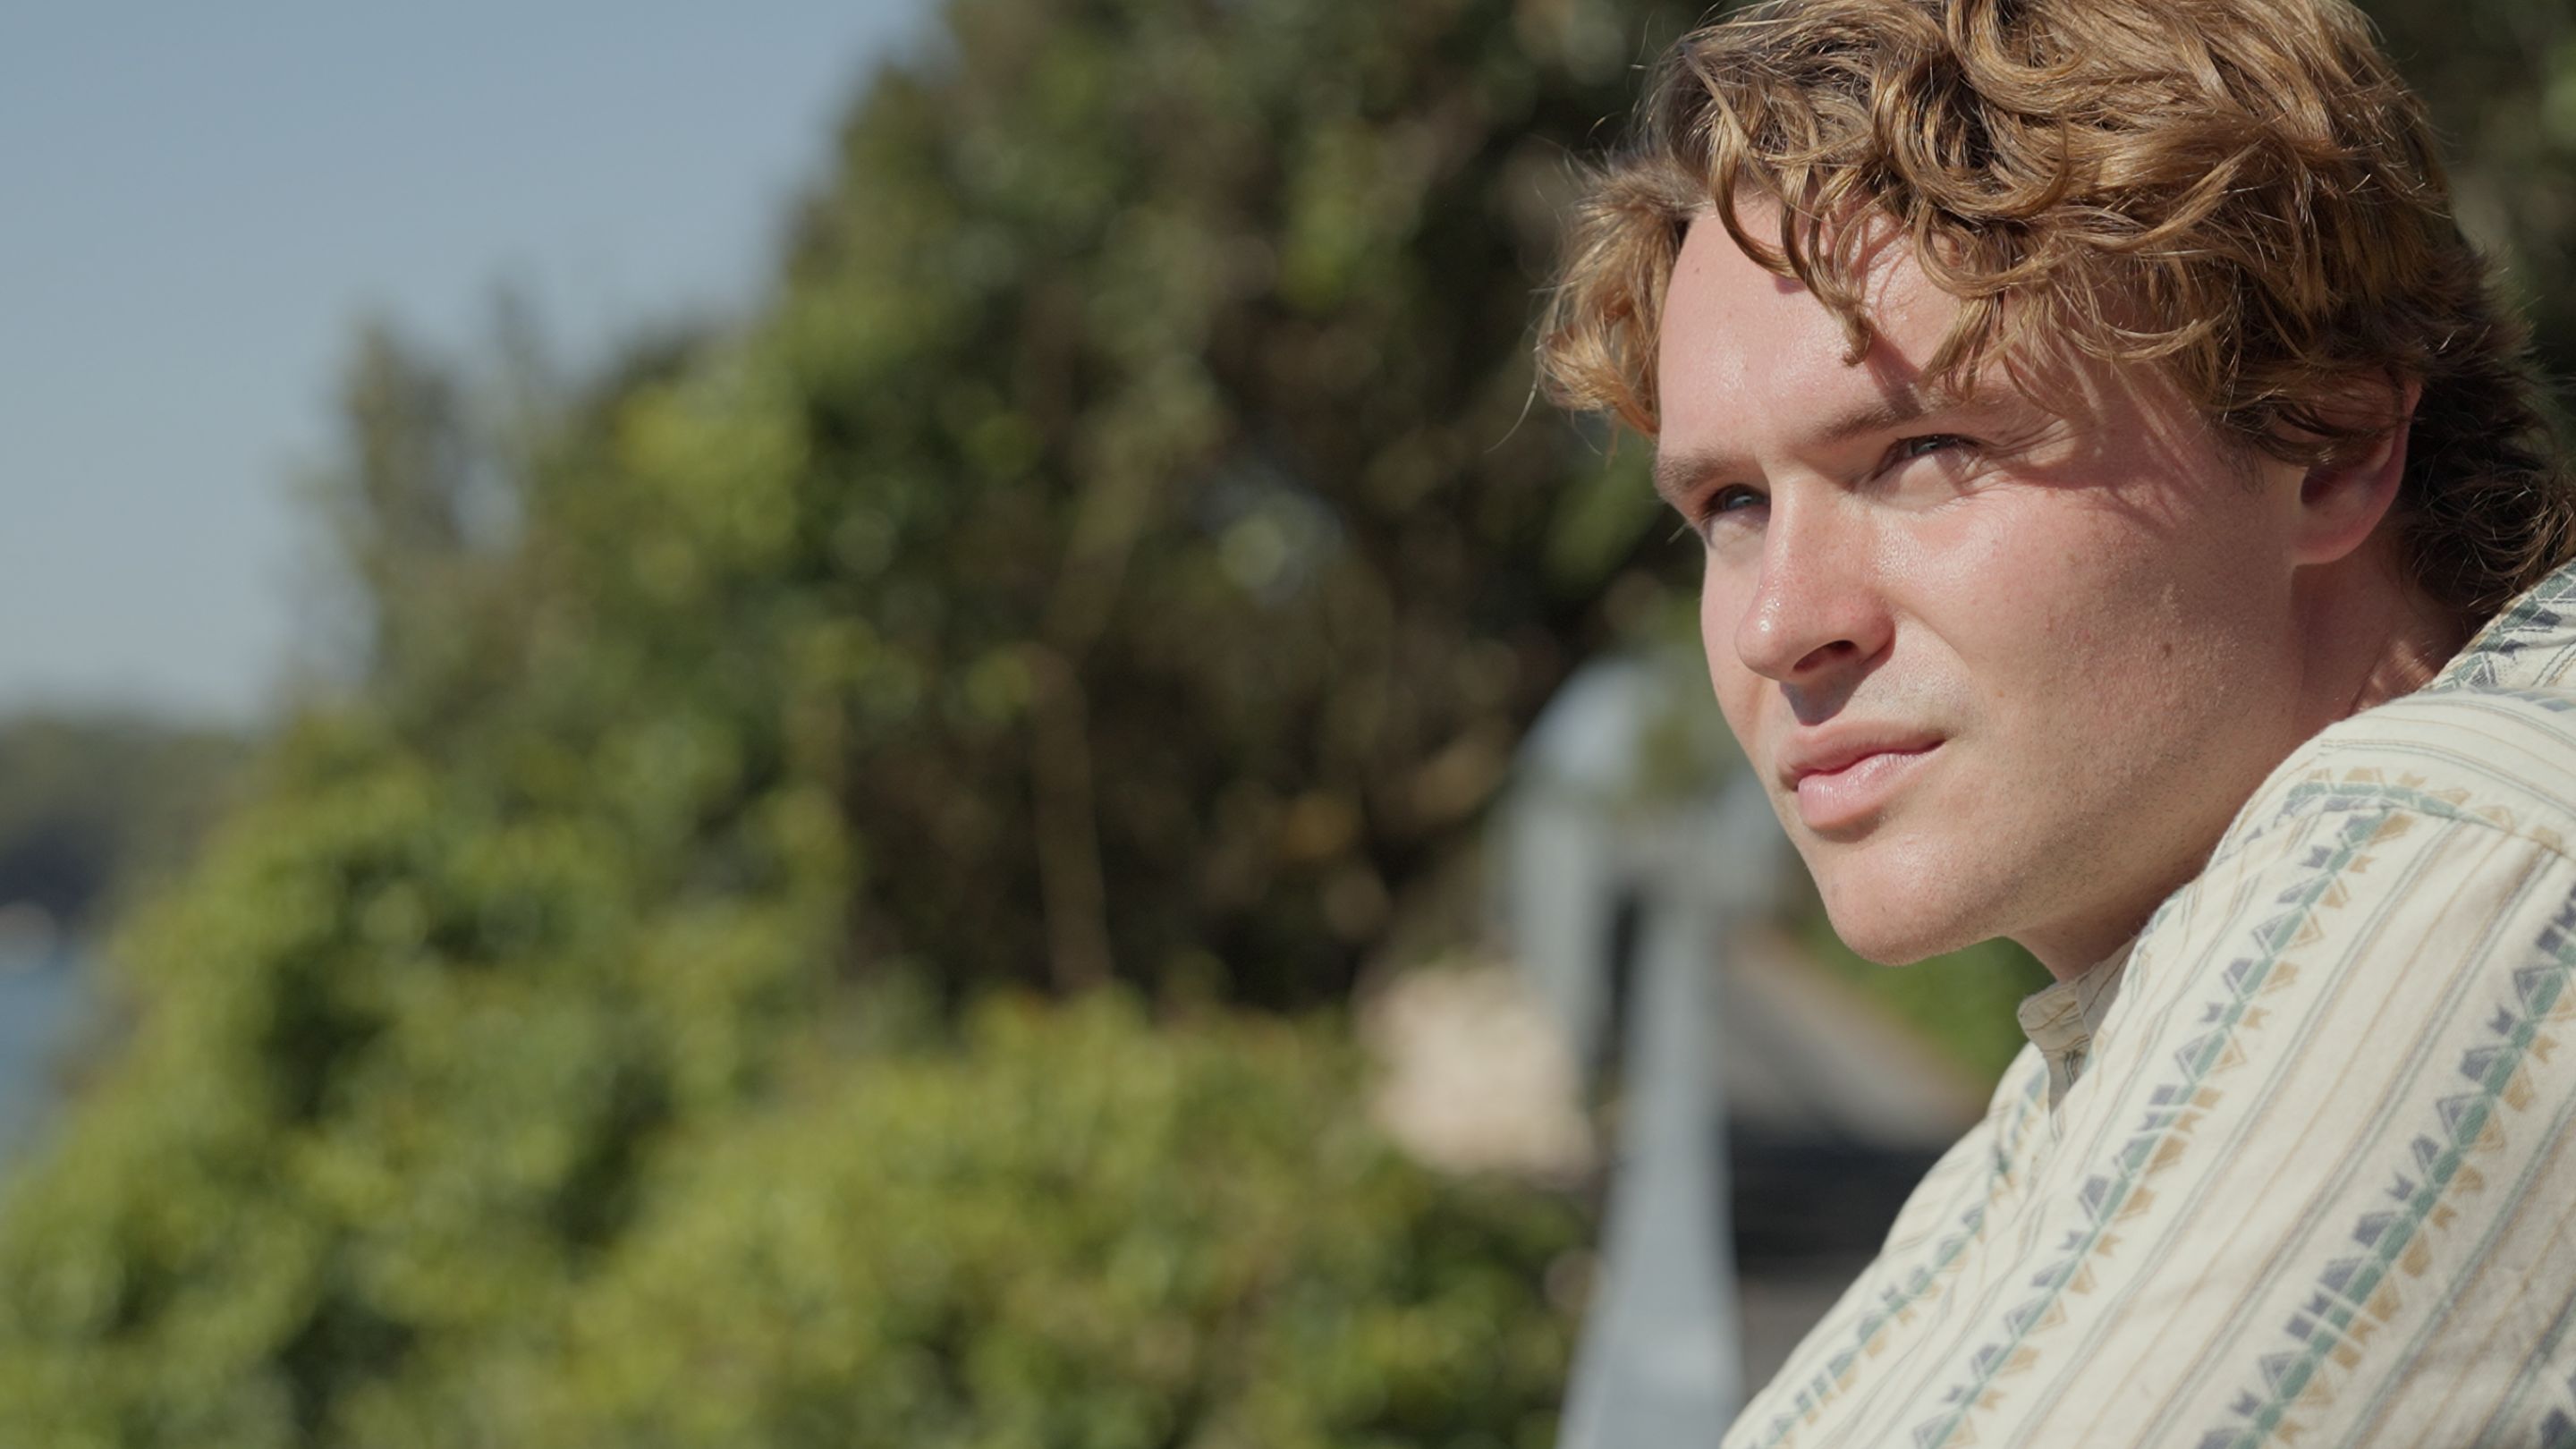
Minderoo Pictures The Plastic Country: Australia's hidden plastic problem
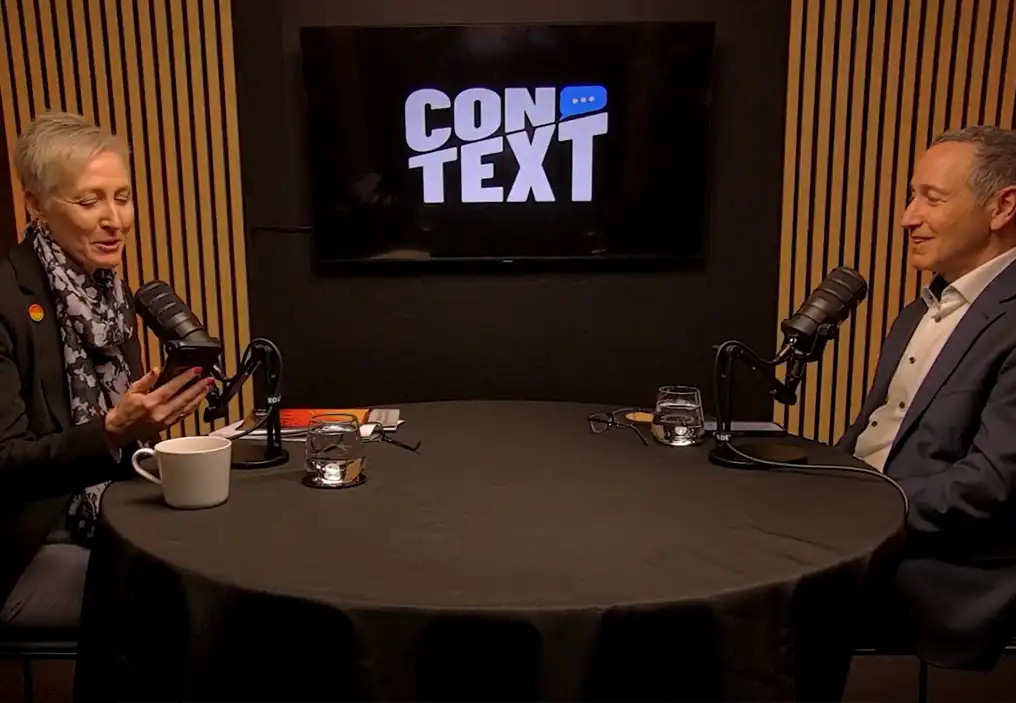
Natural Ecosystems ConTEXT: What on earth is Lethal Humidity?!?
Impact Missions Ukraine: Recovery begins before conflict ends.
Natural Ecosystems What if every voyage helped map life beneath the surface?