Oops! It looks like that page is gone!
But while you’re here, why not dive into some of the latest stories from across Minderoo Foundation.
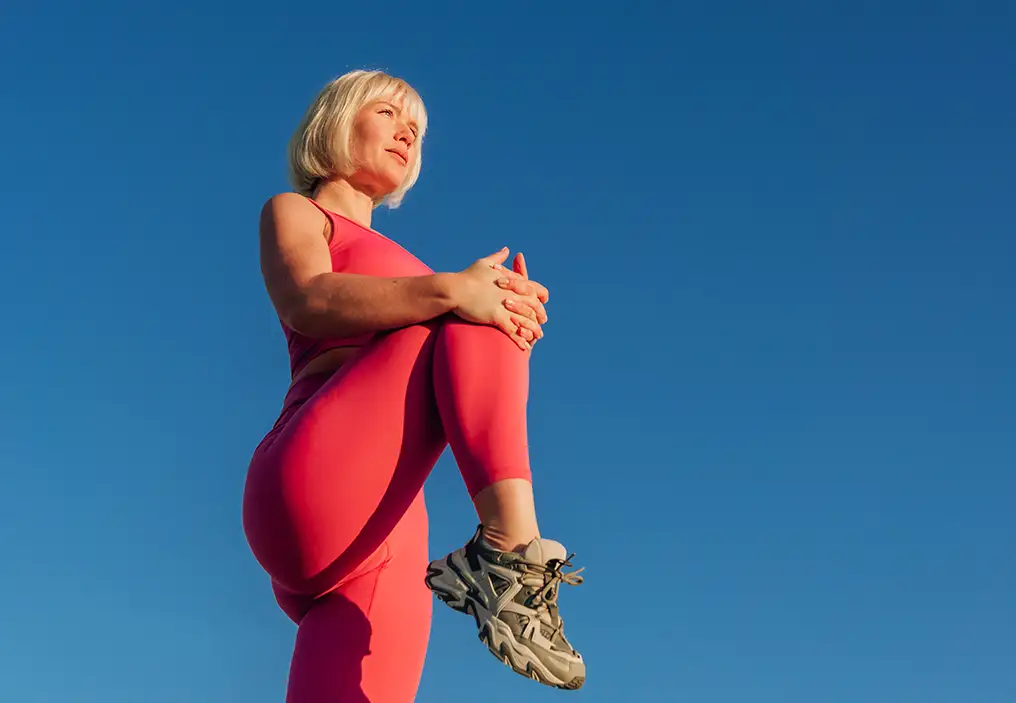
Plastics Could your activewear be making you sick? It may contain PFAS.
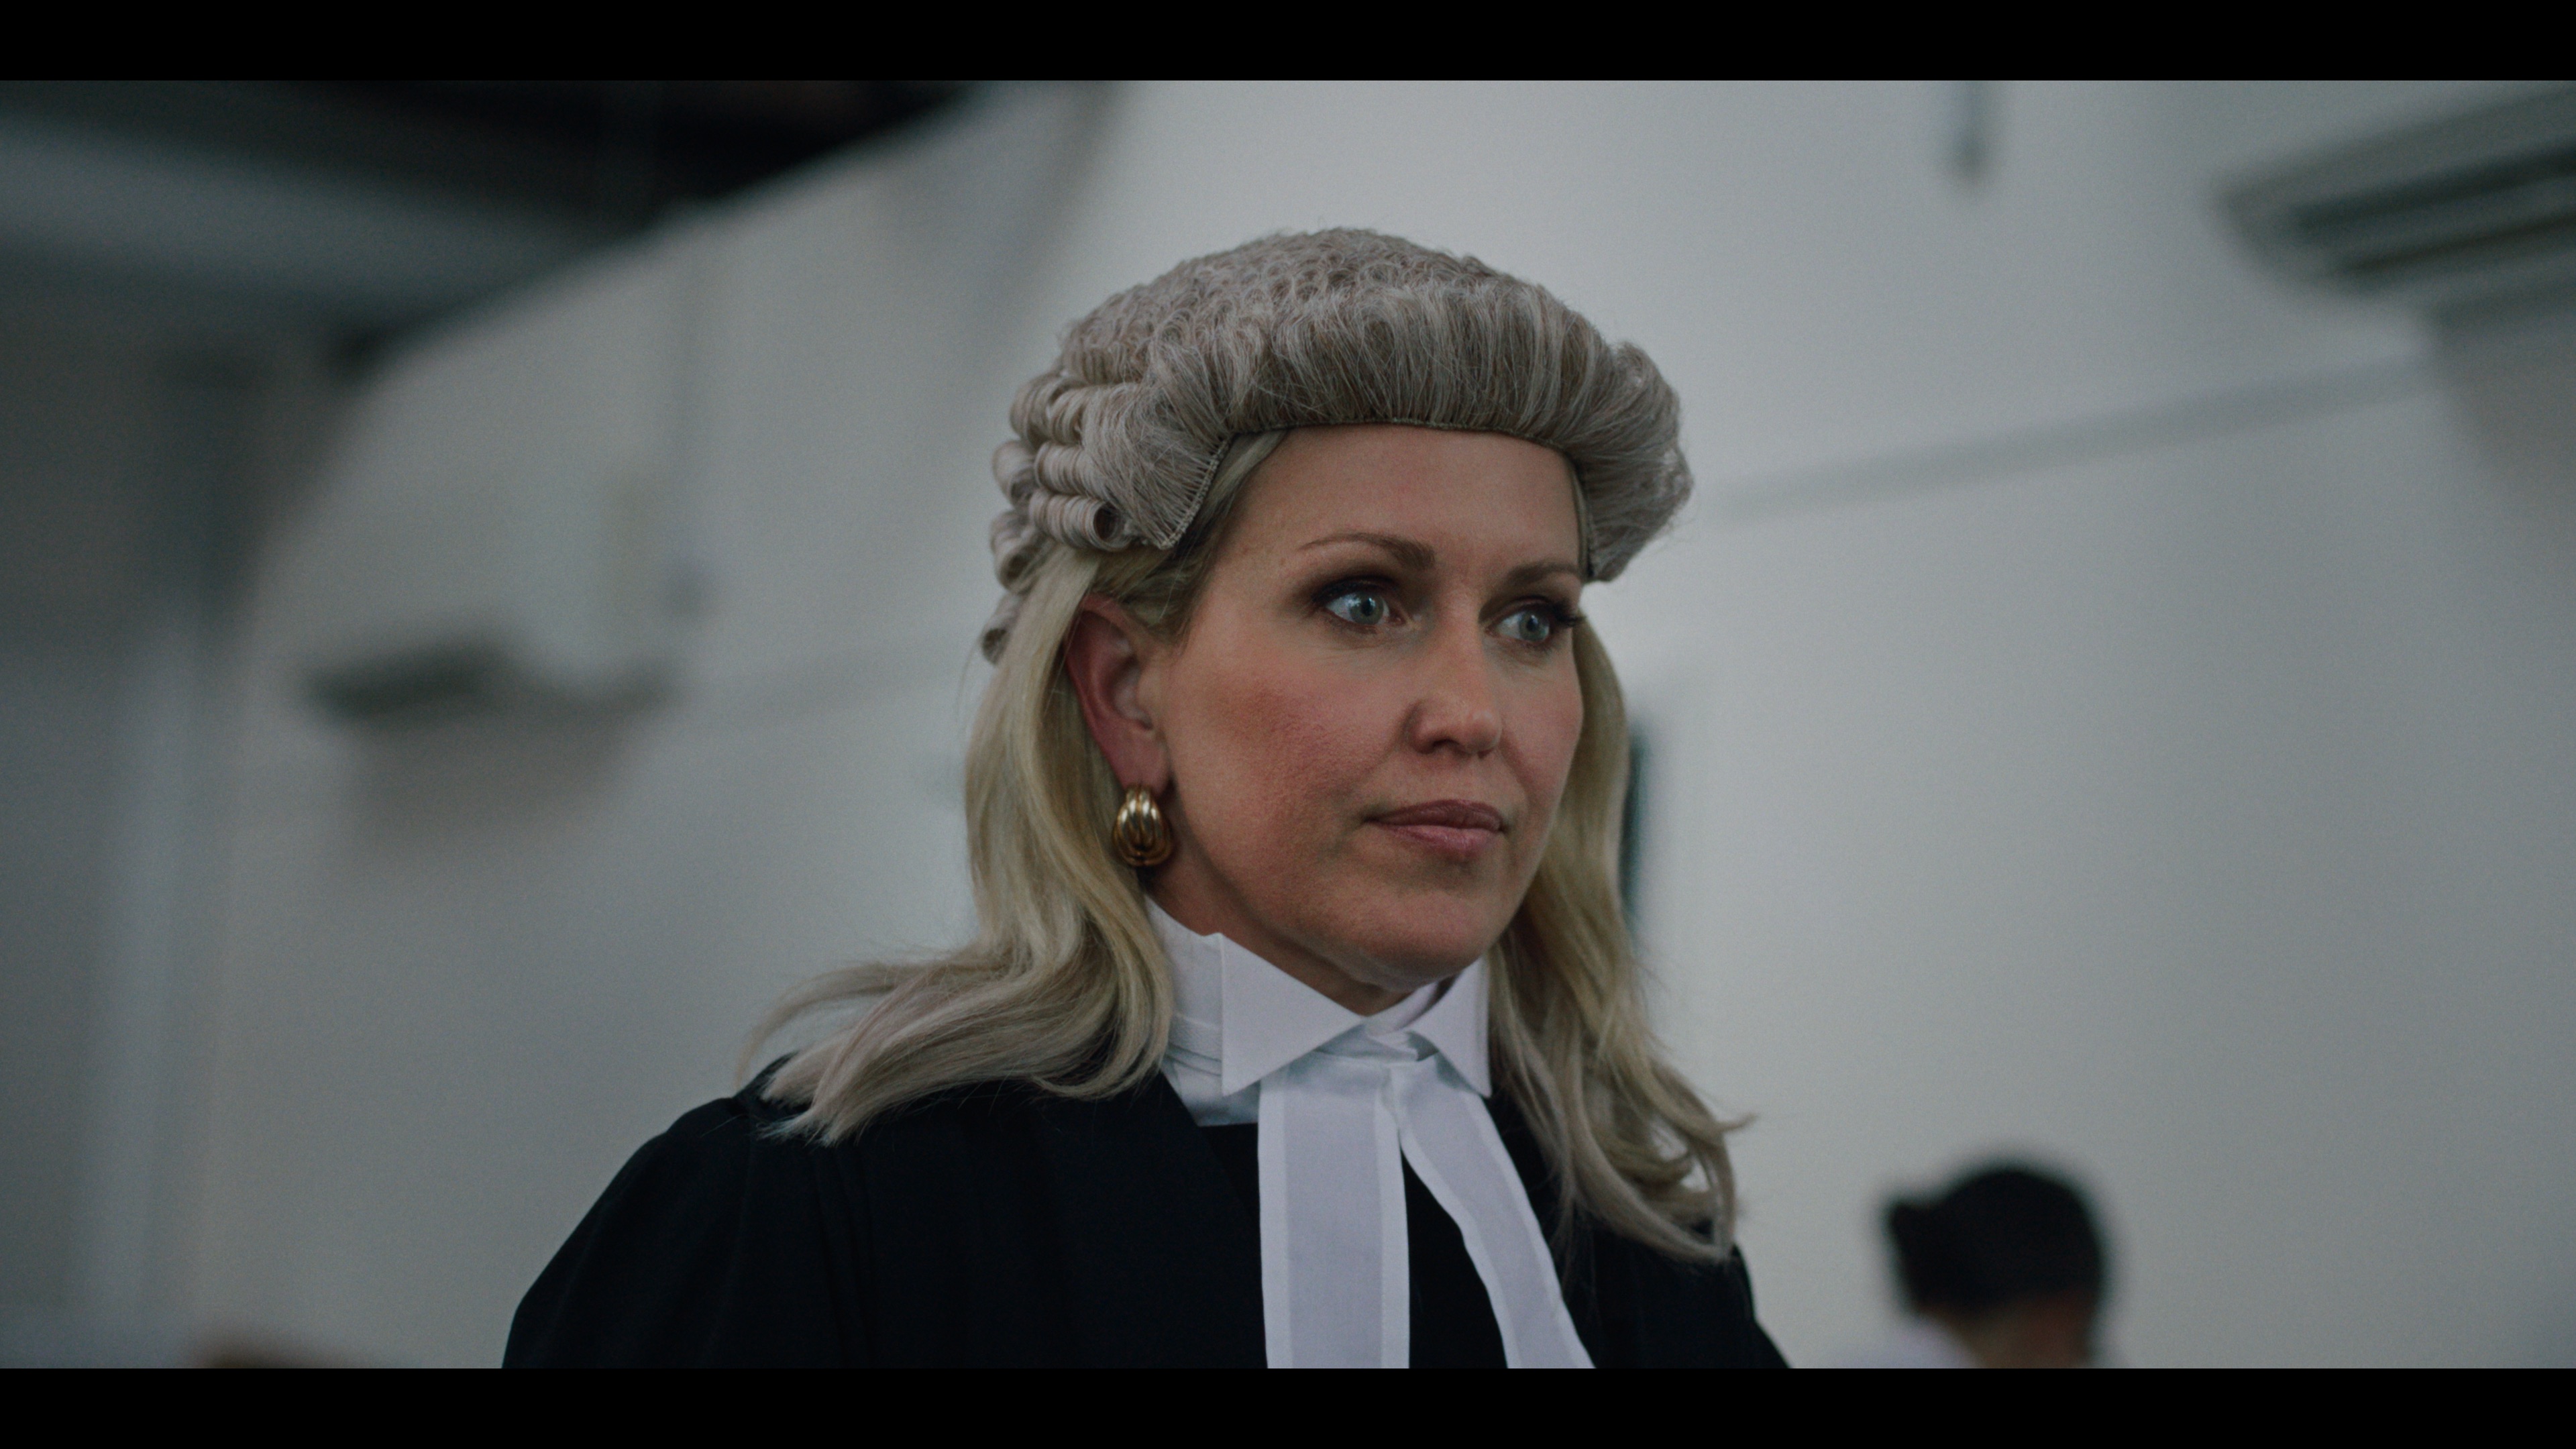
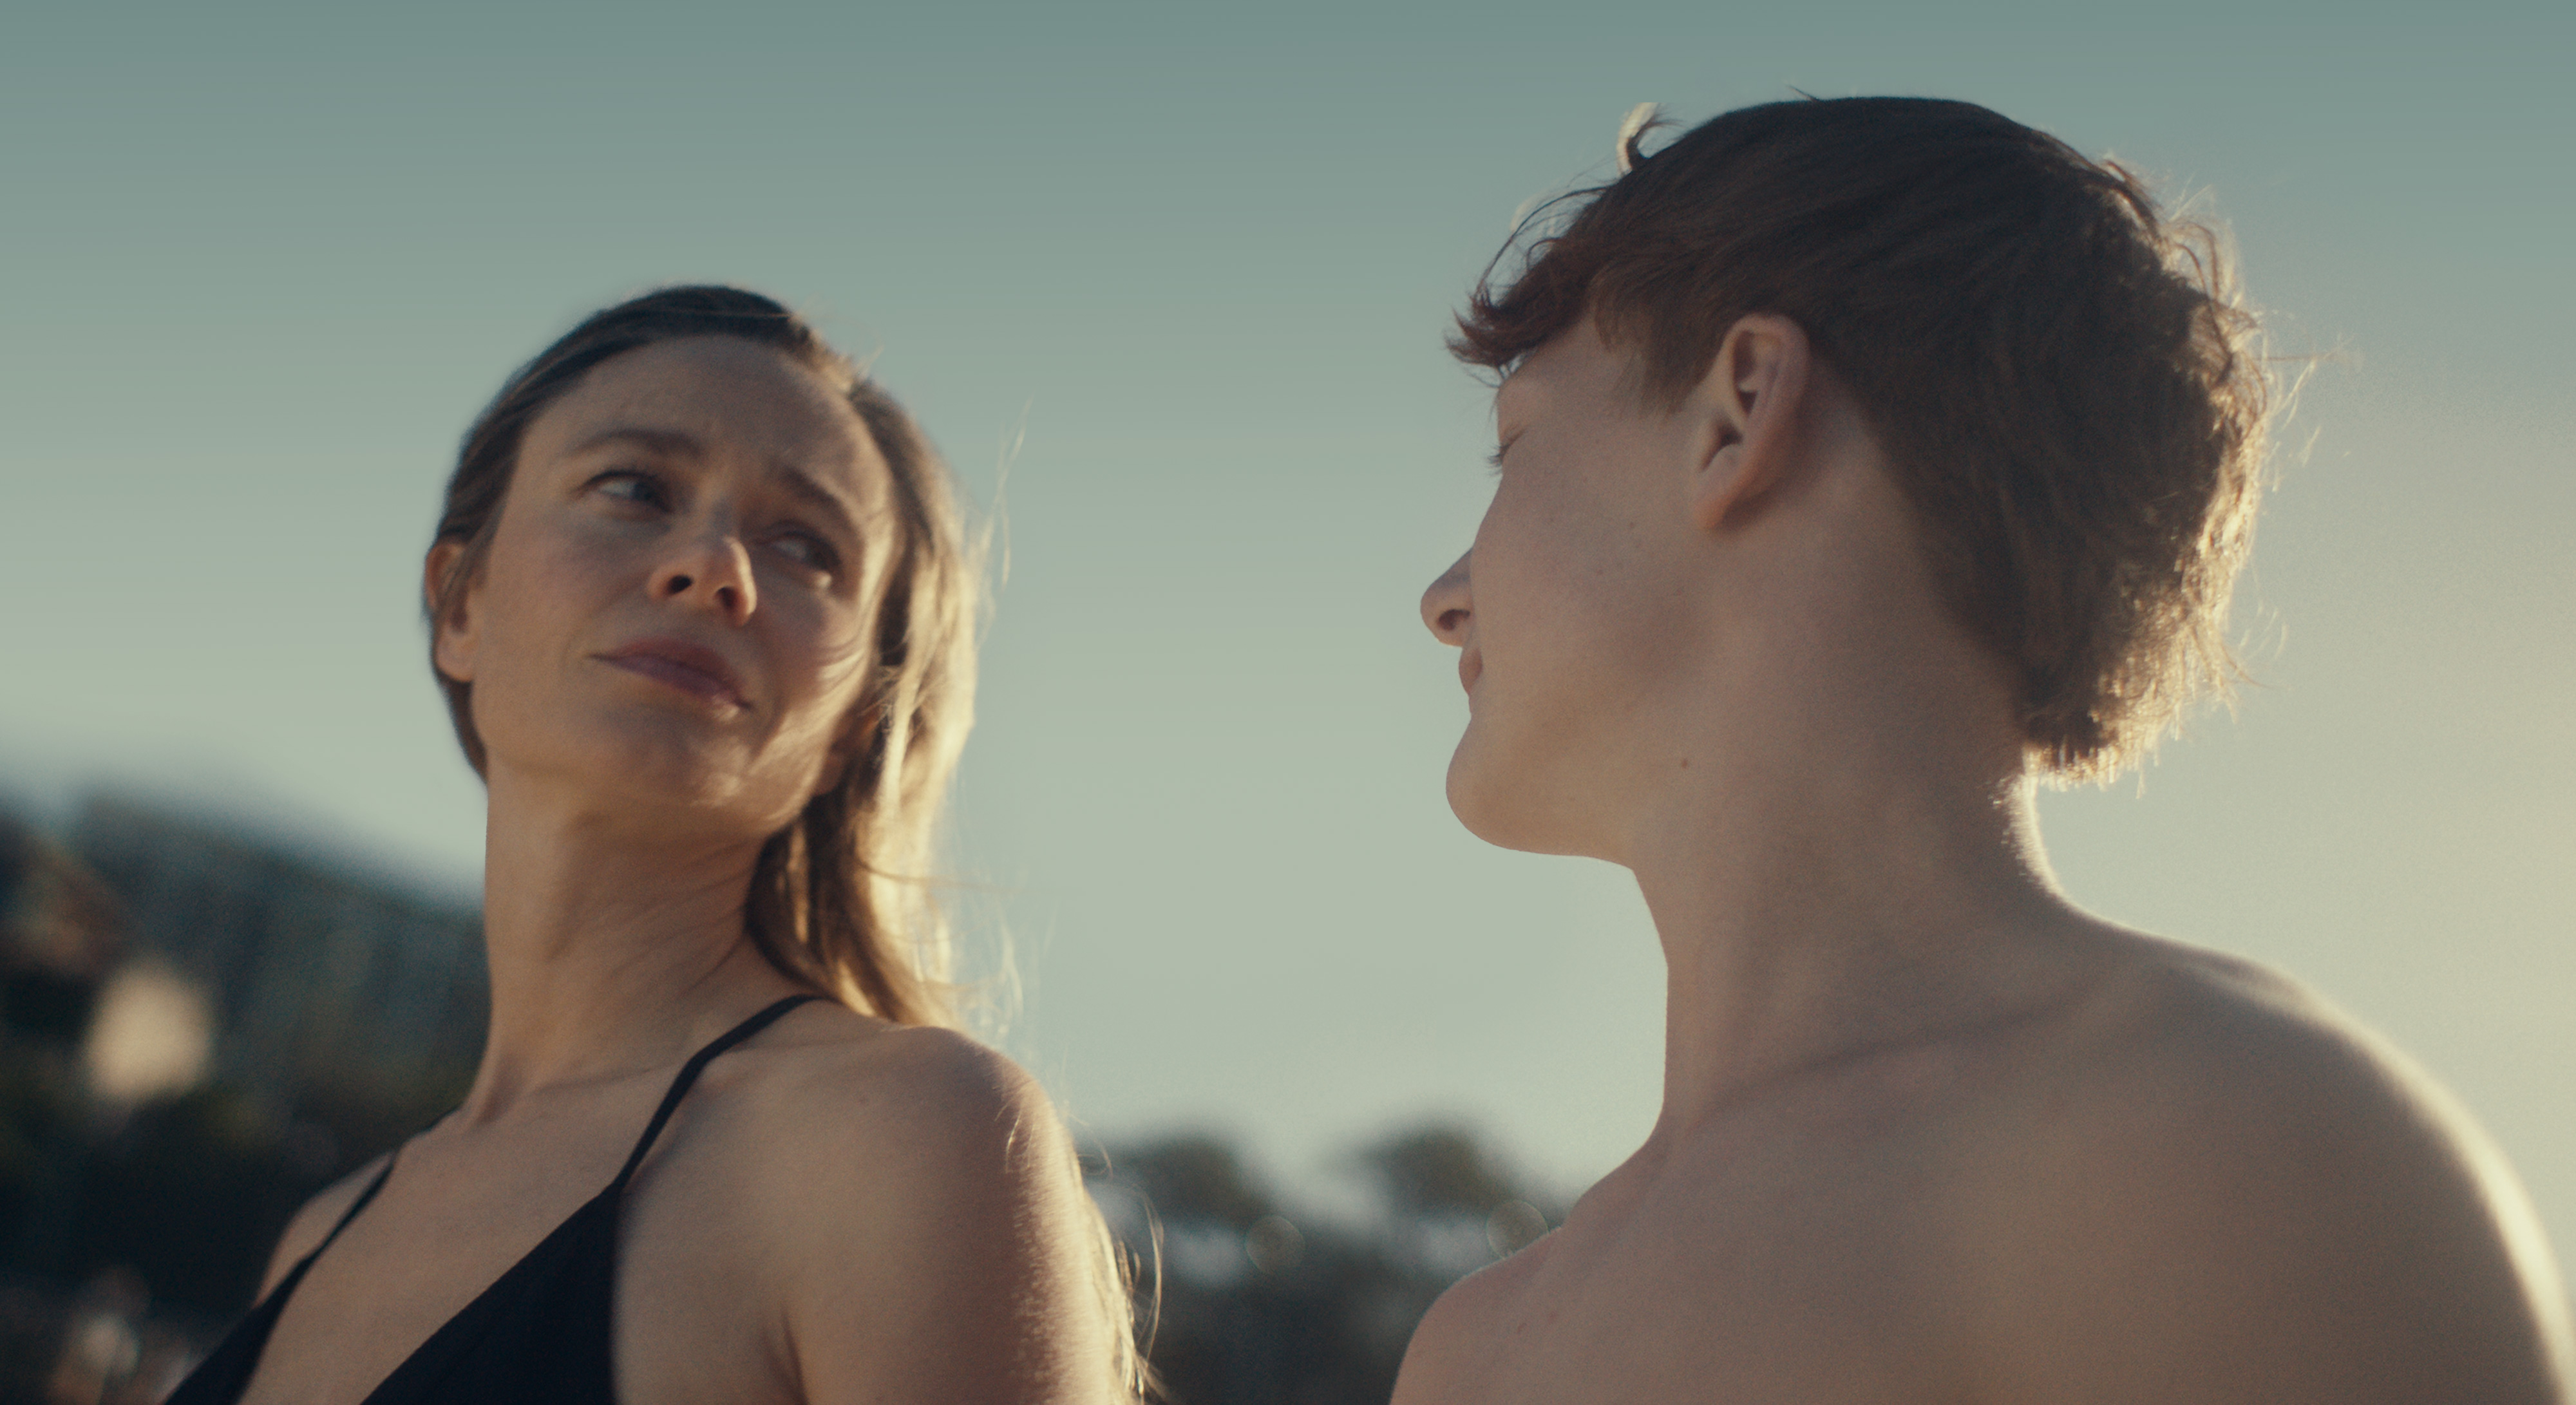
Minderoo Pictures SILENCED: Survivors facing a new kind of silencing
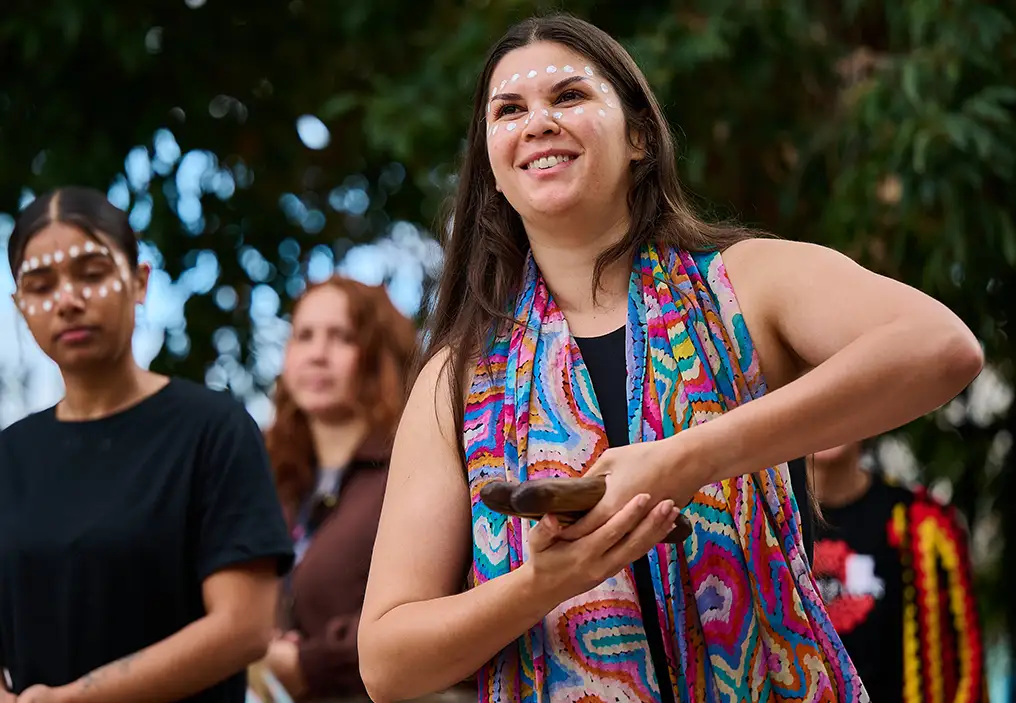
Communities Welcome Baby to Country: Nurturing belonging from the beginning.
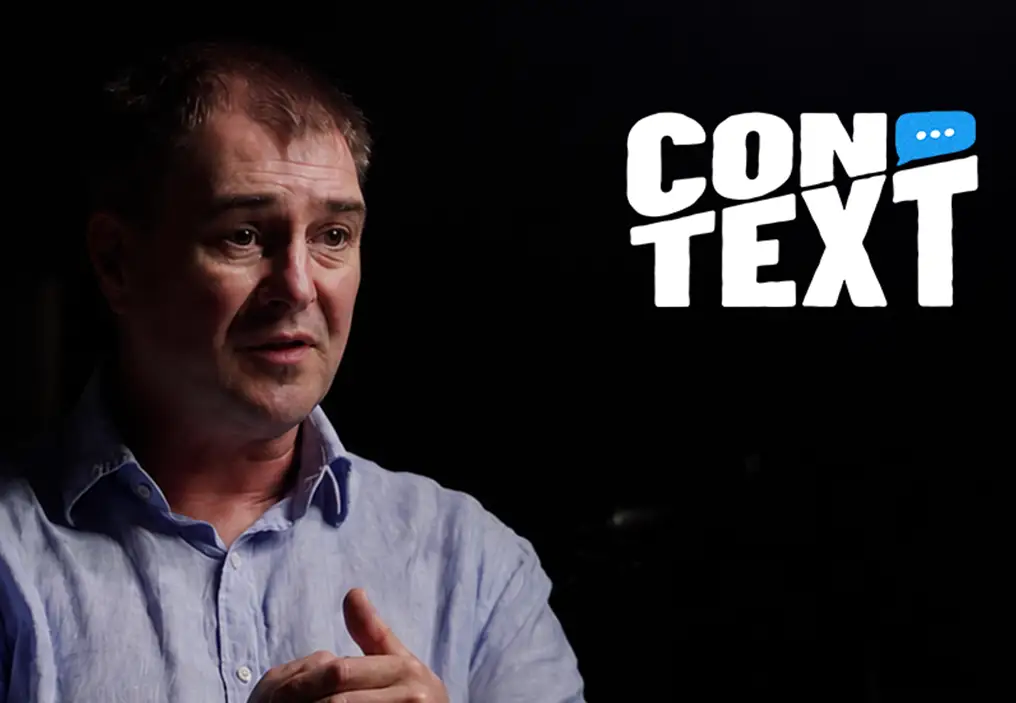
Plastics Plastic pollution isn’t just an environmental issue, it’s a human health issue too.
Natural Ecosystems Spotlight: Ningaloo coral spawning.
Minderoo Pictures Life Could Be a Dream: A story of resilience and reinvention